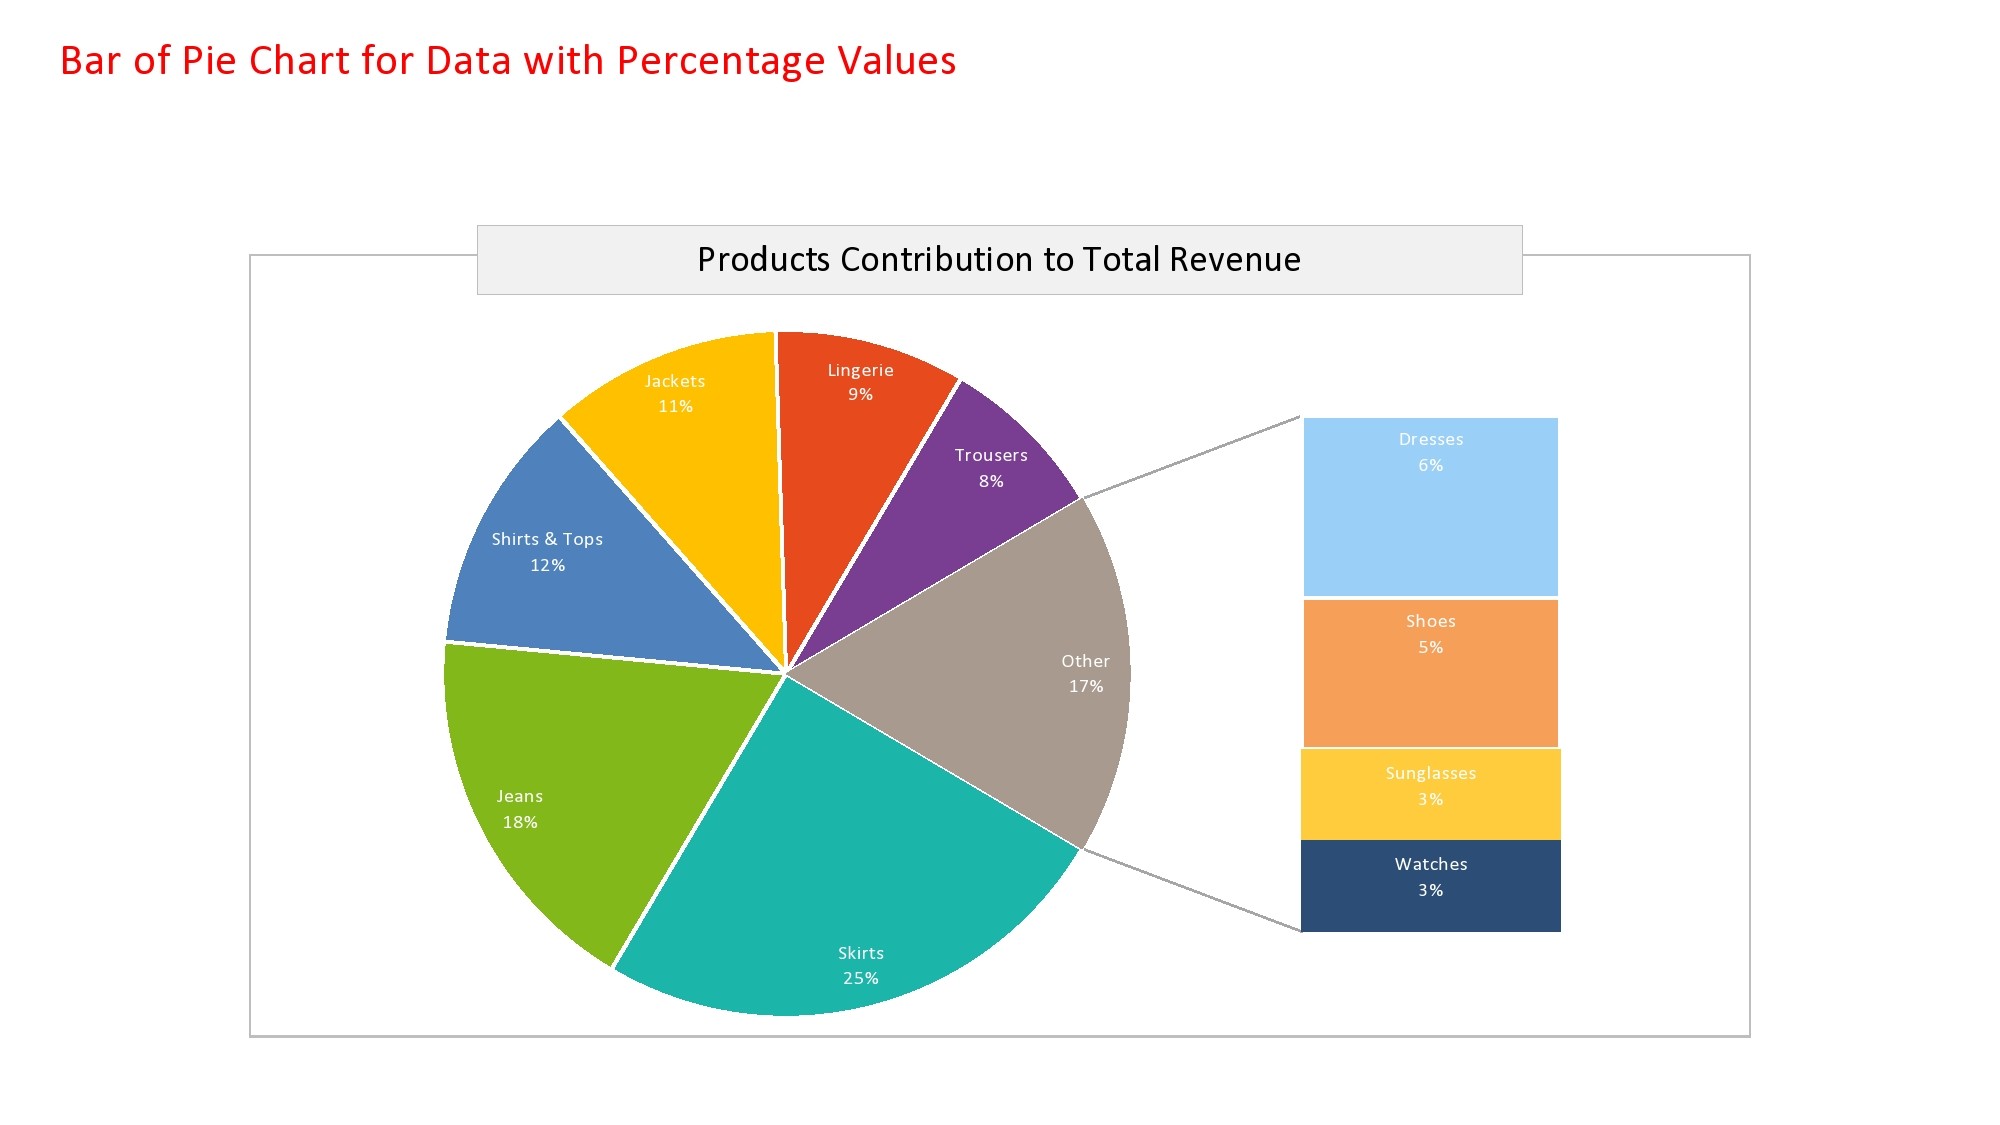
Pie charts are a powerful tool for visualizing data and conveying information in a concise and easy-to-understand format. In this comprehensive guide, we will explore the various aspects of pie charts, including their purpose, benefits, best practices, and how to create them effectively.
Whether you are a student, researcher, or professional, understanding pie charts and their applications can greatly enhance your data analysis skills. So, let’s dive in and uncover the power of pie charts!
What is a Pie Chart?
A pie chart is a circular graph that represents data as slices of a whole. Each slice of the pie chart corresponds to a specific category or value, and the size of each slice is proportional to the quantity it represents. Pie charts are commonly used to display percentages or proportions, making them ideal for showing the distribution of a categorical variable.
For example, imagine you have data on the sales of different products in a store. You can use a pie chart to visualize the percentage of sales for each product category, such as electronics, clothing, and accessories. The size of each slice in the pie chart will indicate the proportion of sales for that category.
Why Use Pie Charts?
Pie charts offer several advantages that make them a popular choice for data visualization:
- Easy to understand: Pie charts present data in a visually appealing and intuitive manner. The circular shape and proportional slices make it easy for viewers to grasp the distribution or proportionality of the data.
- Effective for comparisons: Pie charts allow for quick comparisons between different categories or values. Viewers can easily identify which slices are larger or smaller, enabling them to make informed comparisons.
- Highlighting dominant categories: Pie charts are particularly useful for highlighting dominant or significant categories. The larger slices immediately catch the viewer’s attention, emphasizing their importance.
- Engaging and memorable: The visual nature of pie charts makes them more engaging and memorable than other forms of data representation. Viewers are more likely to retain information presented in a pie chart compared to a table or spreadsheet.
When to Use Pie Charts?
Pie charts are most effective when used to represent data with the following characteristics:
- Categorical data: Pie charts are designed to represent categorical data, where each slice corresponds to a distinct category or value. They are not suitable for continuous or numerical data.
- Relative proportions: Pie charts excel at showing the relative proportions or percentages of different categories. If you want to compare absolute values or show trends over time, other types of graphs, such as bar charts or line graphs, may be more appropriate.
- Less than seven categories: While pie charts can accommodate more categories, they become less effective as the number of categories increases. It is generally recommended to use pie charts for data with fewer than seven categories.


How to Create a Pie Chart?
Creating a pie chart is relatively simple, especially with the help of modern data visualization tools. Here is a step-by-step guide to creating a pie chart:
- Gather your data: Collect the data you want to represent in the pie chart. Ensure that it is in a format suitable for visualization (e.g., numerical values or percentages).
- Choose a data visualization tool: Select a data visualization tool that allows you to create pie charts. Popular options include Microsoft Excel, Google Sheets, Tableau, and Python libraries like Matplotlib and Seaborn.
- Enter your data: Enter your data into the chosen tool. Specify the categories or values and their corresponding quantities or percentages.
- Create the pie chart: Use the tool’s built-in features or functions to generate a pie chart based on your data. Customize the appearance, labels, and colors as desired.
- Review and refine: Take a moment to review the generated pie chart and ensure it accurately represents your data. Make any necessary adjustments or refinements to improve clarity and visual appeal.
Best Practices for Pie Charts
While pie charts are a valuable tool, it is important to follow certain best practices to ensure their effectiveness and accuracy:
- Avoid excessive categories: As mentioned earlier, pie charts become less effective as the number of categories increases. Limit the number of slices to maintain clarity and readability.
- Order slices appropriately: Arrange the slices in descending or ascending order of their values or percentages. This arrangement helps viewers easily identify the largest and smallest categories.
- Label each slice: Label each slice of the pie chart with its corresponding category or value. This labeling ensures clarity and helps viewers understand the data without referring to a legend.
- Avoid 3D effects: While 3D effects may seem visually appealing, they can distort the proportions of the slices and make accurate comparisons difficult. Stick to 2D pie charts for accurate representation.
- Provide additional context: Whenever possible, provide additional context or explanations to complement the pie chart. This context can include explanations of the categories, data sources, or any limitations or assumptions in the data.
Conclusion
Pie charts are a versatile and effective tool for visualizing and understanding data. They provide a clear and intuitive representation of proportions and percentages, making complex information easily digestible. By following best practices and using pie charts appropriately, you can enhance your data analysis skills and effectively communicate your findings. So, the next time you need to represent categorical data or highlight proportions, consider the power of pie charts!
Pie Chart Template Word – Download