If you’ve ever worked on a complex project or managed a team, you’ve probably heard of Gantt charts. But what exactly are they, and why are they so popular?
In this article, we’ll explore the world of Gantt charts, from their history to their benefits and how to create one. Whether you’re a project manager or an entrepreneur, understanding Gantt charts can greatly improve your planning and organization skills. So let’s dive in and discover the power of Gantt charts!
What is a Gantt Chart?
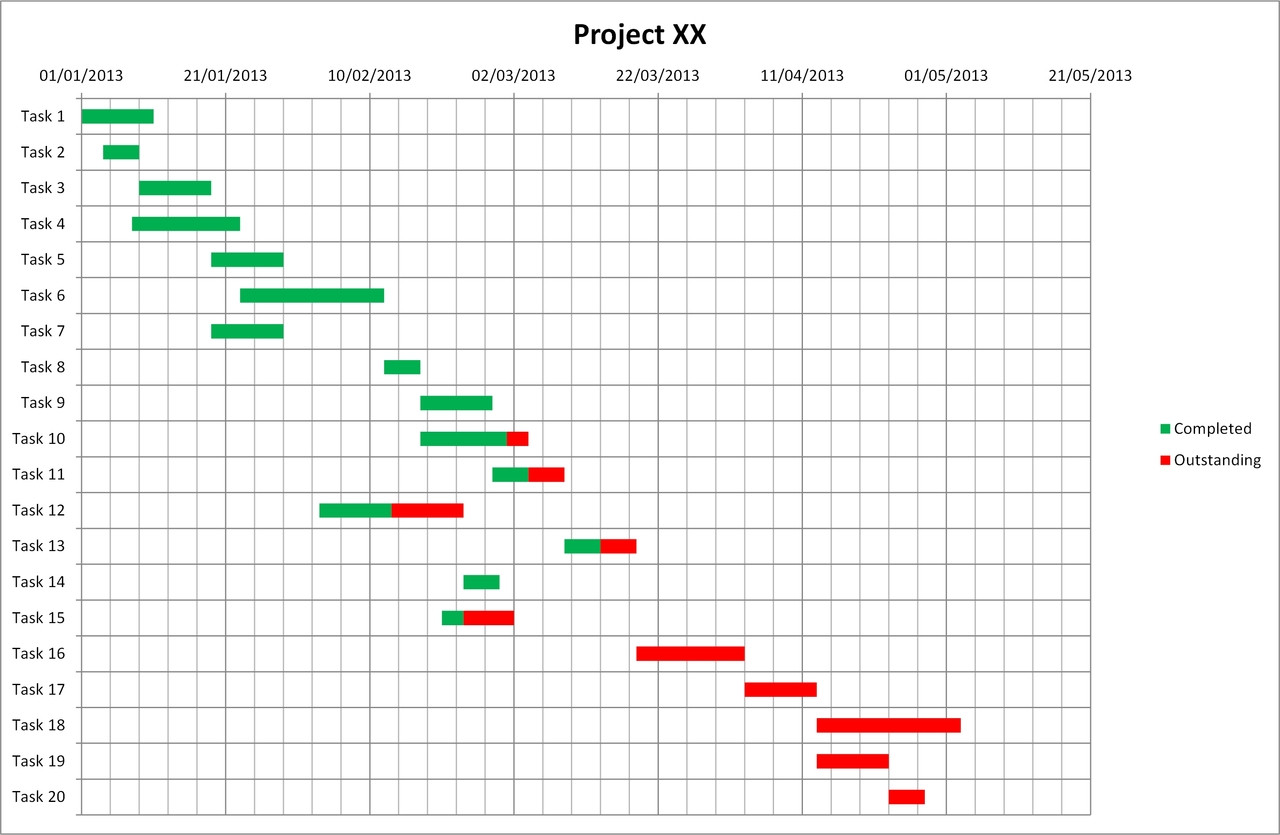
A Gantt chart is a visual representation of a project schedule. It shows the tasks, milestones, and dependencies involved in a project, as well as their start and end dates. Gantt charts provide a clear and concise overview of the project’s progress, allowing project managers to track deadlines, allocate resources, and identify potential bottlenecks. They are widely used in various industries, including construction, software development, and event planning.
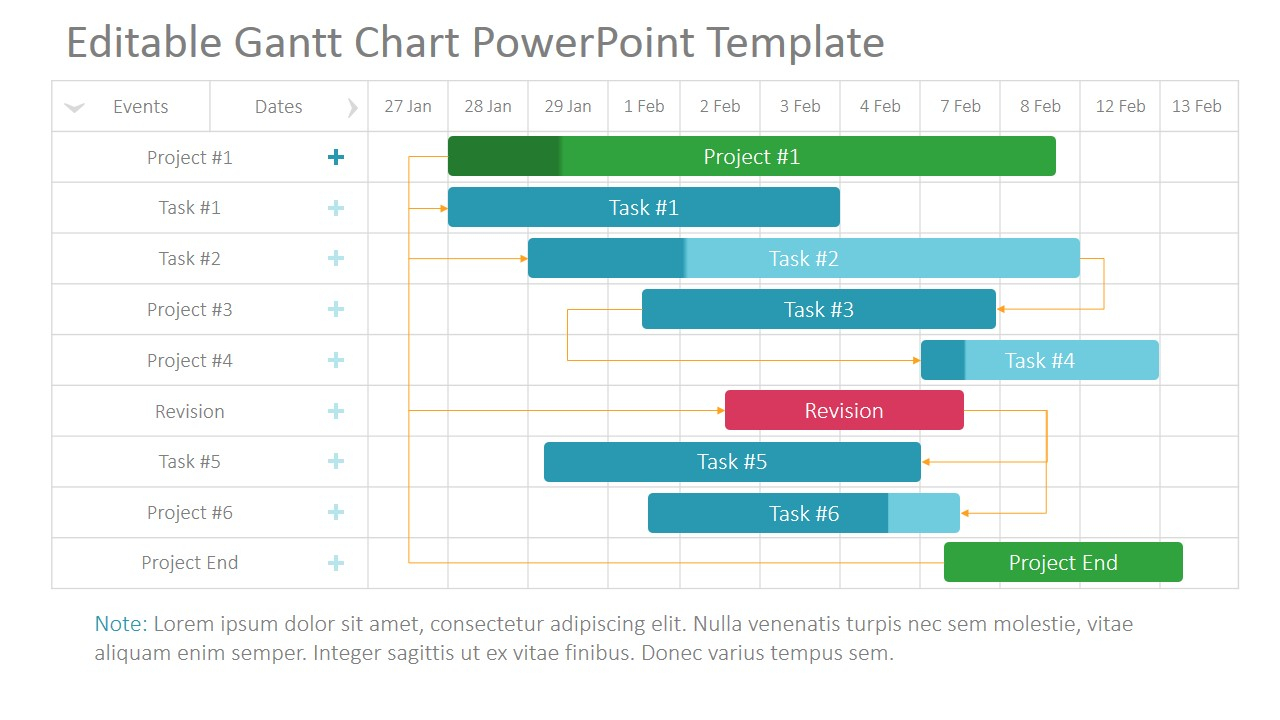
Named after its creator, Henry Gantt, a Gantt chart displays tasks as horizontal bars on a timeline. Each bar represents a specific task, and its length corresponds to the task’s duration. The bars are arranged in chronological order, with dependencies indicated by arrows connecting the bars. This visual representation makes it easy to see how tasks are related and how they contribute to the overall project timeline.
Benefits of Using Gantt Charts
Gantt charts offer several benefits that make them an invaluable tool for project management. Here are some of the key advantages:
- Improved Planning: By visualizing the project timeline and dependencies, Gantt charts help project managers plan and prioritize tasks more effectively. They can easily identify critical path tasks and allocate resources accordingly.
- Enhanced Communication: Gantt charts provide a clear and concise overview of the project’s progress, making it easier to communicate with team members, stakeholders, and clients. Everyone can see the project timeline at a glance and understand the current status.
- Deadline Tracking: With Gantt charts, project managers can easily track deadlines and ensure that tasks are completed on time. They can identify potential delays and take proactive measures to keep the project on track.
- Resource Allocation: Gantt charts allow project managers to allocate resources efficiently. They can see which tasks require more resources and adjust the team’s workload accordingly. This helps prevent overloading or underutilizing resources.
- Risk Management: Gantt charts help identify potential risks and bottlenecks in the project timeline. Project managers can proactively address these issues and minimize their impact on the overall project.
- Increased Efficiency: By providing a visual representation of the project schedule, Gantt charts help improve efficiency and productivity. Team members can easily see their tasks and deadlines, reducing confusion and improving collaboration.
How to Create a Gantt Chart
Creating a Gantt chart may seem daunting at first, but with the right tools and methodology, it can be a straightforward process. Here are the steps to create a Gantt chart:
- Define the Project: Start by clearly defining the project’s goals, scope, and deliverables. This will help you identify the tasks and milestones that need to be included in the Gantt chart.
- List the Tasks: Make a list of all the tasks required to complete the project. Break them down into smaller, manageable subtasks if necessary.
- Determine Dependencies: Identify the dependencies between tasks. Determine which tasks need to be completed before others can begin.
- Estimate Durations: Estimate the duration of each task. This will help you allocate resources and schedule the project timeline.
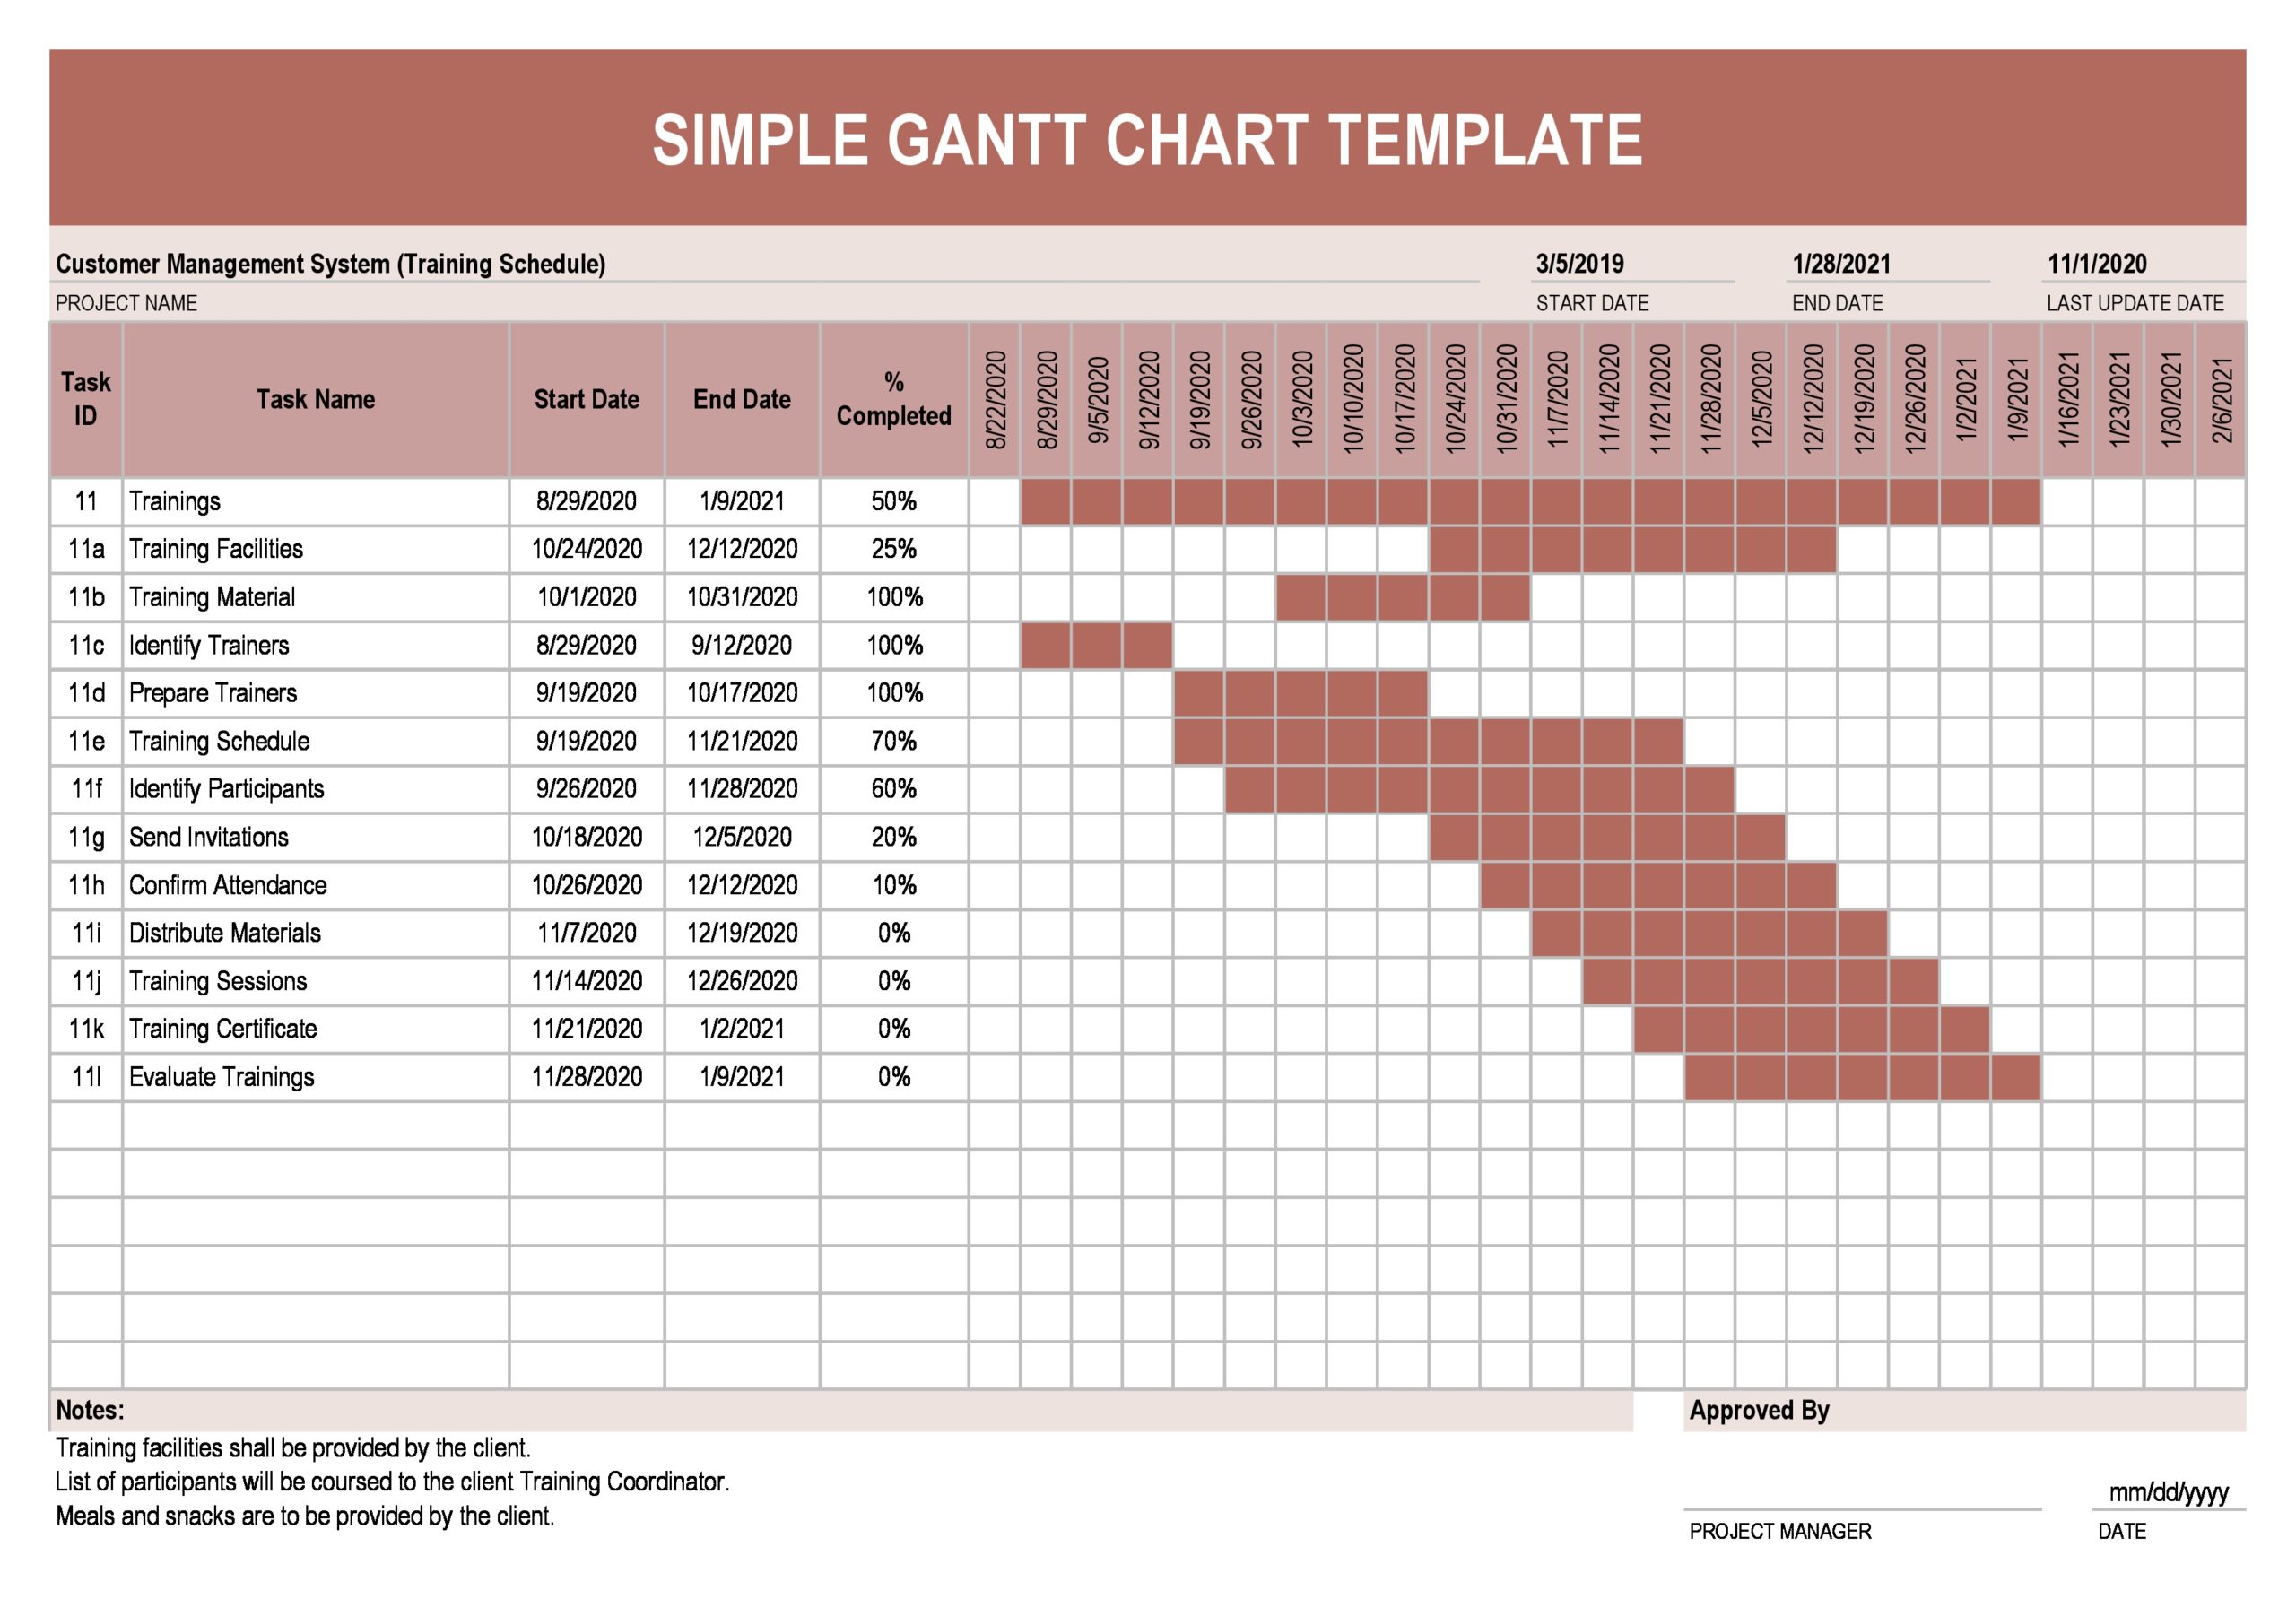
- Create the Gantt Chart: Use Gantt chart software or a spreadsheet program to create the chart. Input the tasks, start dates, end dates, and dependencies.
- Adjust and Update: As the project progresses, update the Gantt chart to reflect any changes or delays. This will help you stay on top of the project’s progress and make informed decisions.
Example of a Gantt Chart
Let’s say you’re planning a website development project. Here’s an example of how your Gantt chart might look:


In this example, each task is represented by a horizontal bar, and the length of the bar corresponds to the task’s duration. The arrows indicate dependencies between tasks. By looking at the Gantt chart, you can easily see the project’s timeline, critical path tasks, and potential bottlenecks.
Top Gantt Chart Software
There are various Gantt chart software options available that can help you create and manage Gantt charts more efficiently. Here are some of the top software tools:
- Microsoft Project: A comprehensive project management software that includes Gantt chart functionality.
- Smartsheet: A powerful collaboration and project management tool that offers Gantt chart templates.
- TeamGantt: An intuitive and user-friendly Gantt chart software designed for project teams.
- Wrike: A versatile project management software that allows you to create Gantt charts and track progress.
- Monday.com: A visual project management platform with Gantt chart capabilities.
- Asana: A popular project management tool that offers Gantt chart views for better project planning.
Conclusion
Gantt charts are a powerful tool for project management, providing a visual representation of project schedules, dependencies, and milestones. By using Gantt charts, project managers can improve planning, enhance communication, track deadlines, allocate resources efficiently, and manage risks effectively. With the right software and methodology, creating and maintaining Gantt charts can be a straightforward process. So whether you’re managing a small team or overseeing a complex project, consider incorporating Gantt charts into your workflow for better organization and success.
Gantt Chart Template Excel – Download