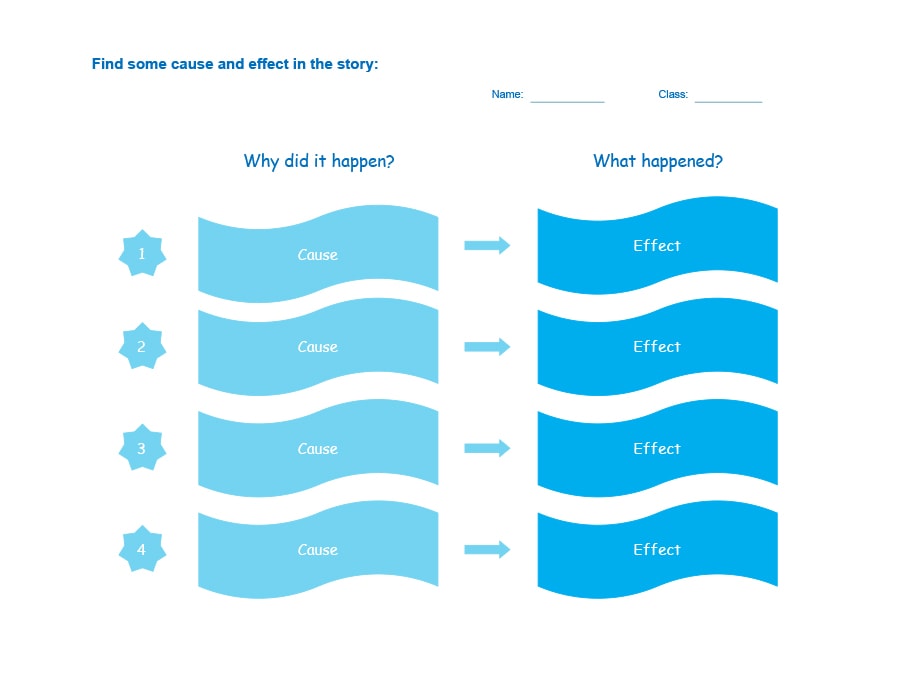
When organizing information, finding patterns, and making decisions, having a visual tool can be incredibly helpful. One such tool is the T-chart, a graphic organizer that divides information into two categories and allows for easy comparison and contrast. Whether you’re a student, a professional, or just someone who likes to stay organized, the T-chart can be a valuable tool in your arsenal.
In this article, we’ll explore what a T-chart is, why it’s useful, how to create one, and provide some examples and tips for successful use.
What is a T-Chart?
A T-chart is a graphic organizer that consists of a T-shaped diagram. It is used to categorize and compare information, ideas, or concepts, making it easier to identify similarities, differences, patterns, and relationships.
The T-chart is divided into two columns or categories, with the central vertical line representing the point of comparison. The left column is typically used for one category, while the right column is used for the other. This simple yet effective visual tool can help users analyze information, brainstorm ideas, and make informed decisions.

Why Use a T-Chart?
There are several reasons why using a T-chart can be beneficial:
- Comparison and Contrast: The T-chart allows you to compare and contrast ideas or information side by side, making it easier to identify similarities and differences.
- Pattern Identification: By organizing information in a T-chart, patterns and relationships can become more apparent, helping you to better understand the data.
- Decision Making: When faced with a decision, a T-chart can help you weigh the pros and cons, enabling you to make a more informed choice.
- Visual Organization: The visual nature of the T-chart makes it easier to see the overall structure and organization of information.
- Enhanced Learning: For students, using a T-chart can aid in comprehension and retention of information, as it encourages active thinking and engagement.
How to Create a T-Chart
Creating a T-chart is a straightforward process. Here’s a step-by-step guide to help you get started:
- Determine the Purpose: Clarify the purpose of your T-chart. What information or ideas are you trying to compare or contrast?
- Identify the Categories: Decide on the two categories you want to use for comparison. These could be anything from concepts, characteristics, features, or options.
- Draw the T-chart: On a blank piece of paper or using a digital tool, draw a vertical line down the middle, dividing the page into two columns. Write the category labels at the top of each column.
- Fill in the Chart: Start populating the T-chart with relevant information or ideas. Place each item or concept in the appropriate column based on its category.
- Analyze and Interpret: Once the T-chart is complete, take a step back and analyze the information. Look for patterns, connections, and insights that may arise from the comparison.
Examples


Tips for Successful Use of a T-Chart
To make the most of your T-chart, consider the following tips:
- Be Clear and Specific: Clearly define the categories and ensure that the items or ideas you place in each column are specific and relevant.
- Use Consistent Criteria: When comparing and contrasting, try to use the same criteria for each item to maintain a fair analysis.
- Consider Multiple Perspectives: If appropriate, involve others in the process to gain different perspectives and insights.
- Keep it Concise: Avoid overcrowding the T-chart with too much information. Focus on the key points and main comparisons.
- Update and Revise: As new information or ideas arise, feel free to update and revise your T-chart to reflect the latest insights.
- Experiment with Different Formats: While the traditional T-chart is effective, don’t be afraid to experiment with variations such as Venn diagrams or tables to suit your specific needs.
Conclusion
A T-chart is a versatile graphic organizer that can help you compare and contrast ideas, identify patterns, and make decisions. Whether you’re a student, a professional, or someone who simply wants to stay organized, the T-chart can be a valuable tool.
By following the steps outlined in this article and considering the tips provided, you can successfully create and utilize T-charts to enhance your understanding and decision-making processes.
T-Chart Template – Download